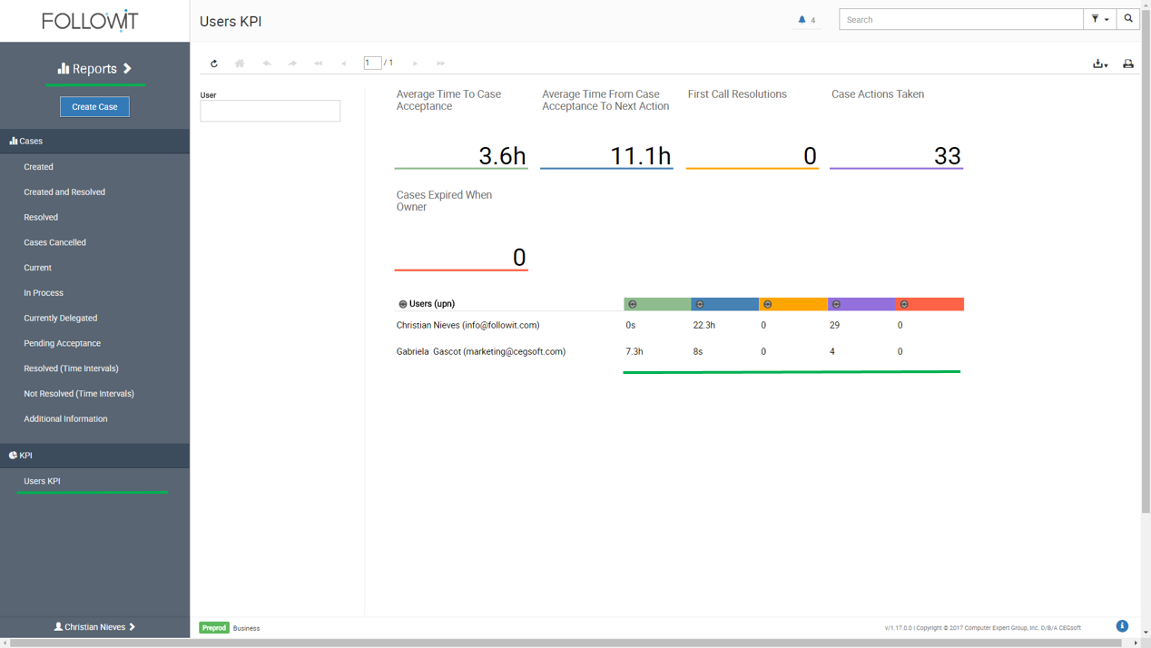
Followit’s key performance indicators (KPI) report allows you to know how users are performing within your environment by measuring the average time users take on particular actions. When you visit the KPI section you will be presented with an overall summary on how your users are performing. If you want to investigate in more detail, simply click on the average number presented on screen. In this report you can see the average performance of users when it comes to:
Average Time to Case Acceptance: This report displays the average time the user took to accept a case that was assigned to him.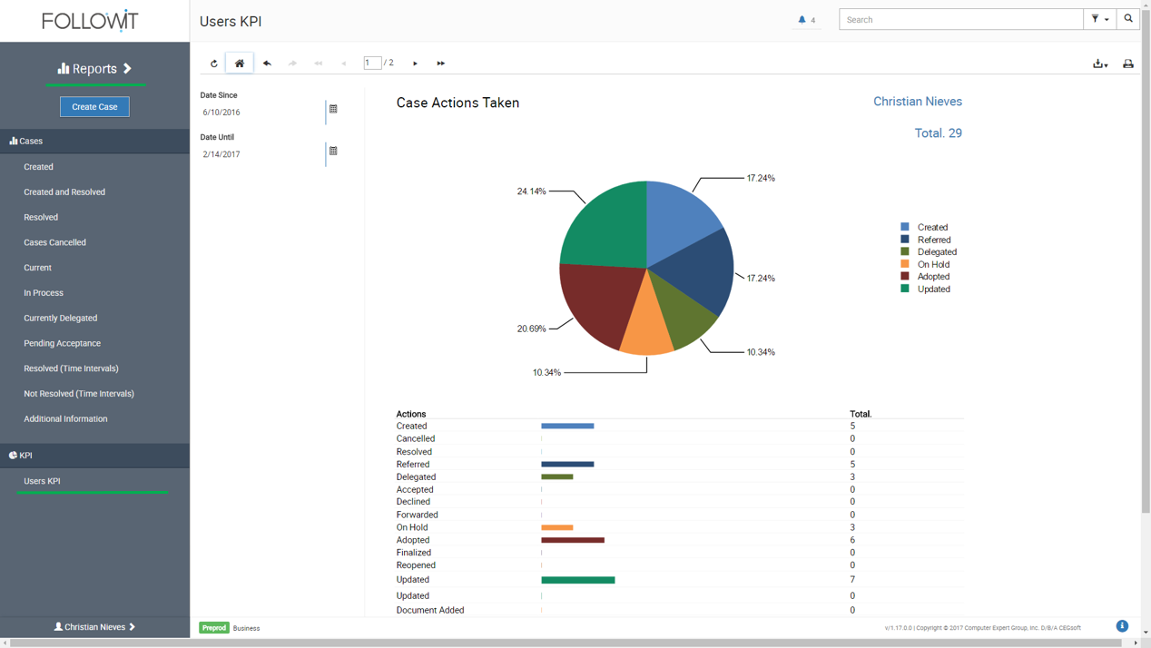
All of these KPI reports can be filtered by:
To access User KPI’s Reports follow these steps:
Important: The KPI average and values presented will be based on the data gathered and analyzed from the implementation of the new KPI report until the day prior of the KPI report being generated. For example, if you generate the report on August 20, 2016 the KPI averages and values will be based on the data gathered from August 17, 2016 (date of new feature implementation) until August 19, 2016 (last date analyzed).
Our Software Solutions are tailored to foster efficient, cost effective, and environmentally friendly workplaces.
More about us